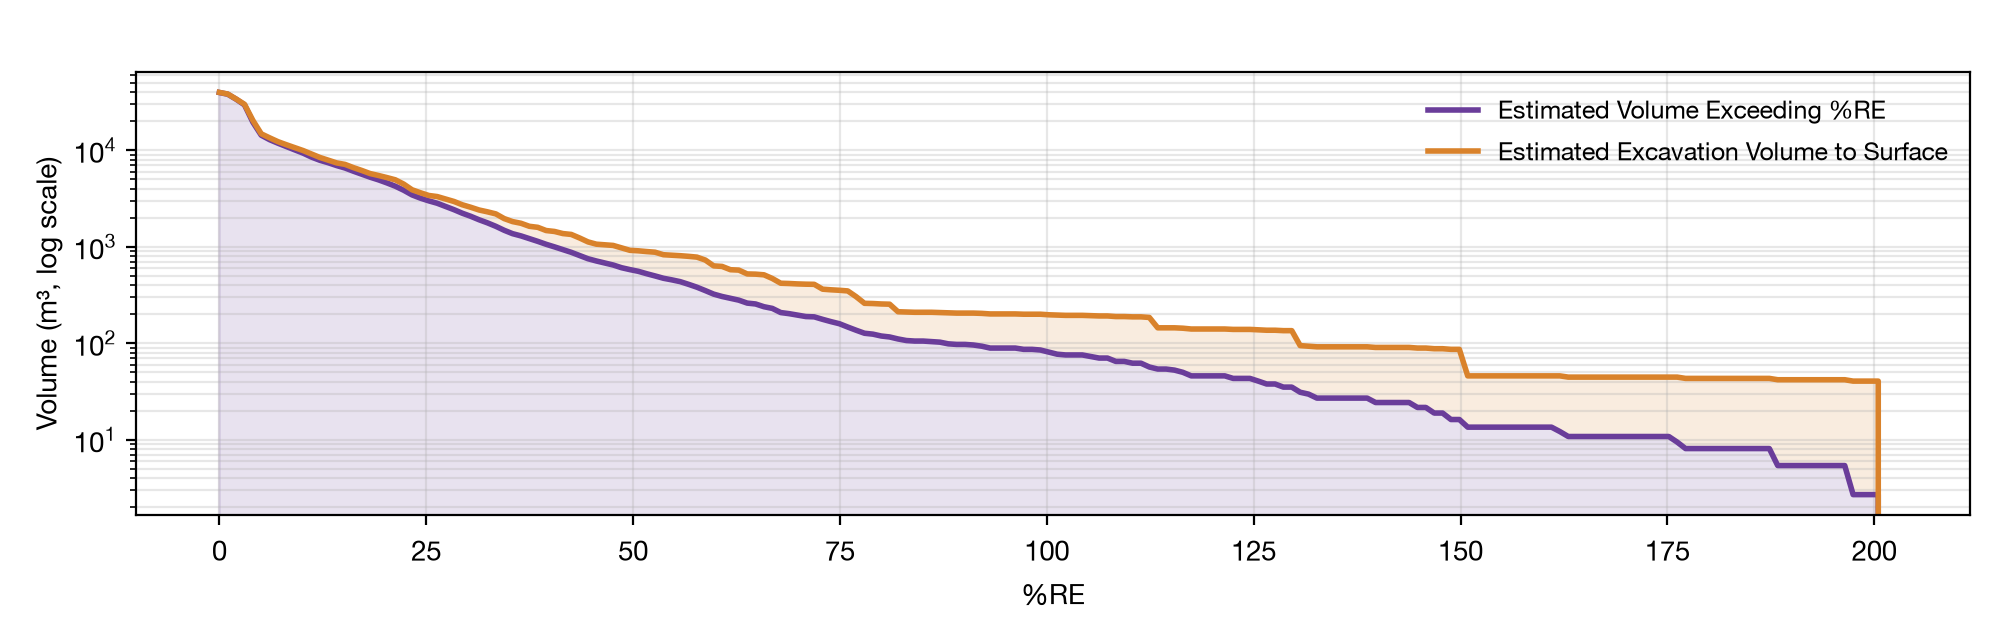
Estimated Excavation Volume to Surface
This curve is the estimated total volume that would have to be excavated to fully remove everything exceeding a given %RE threshold. This contains the original exceedance volume itself, plus the overburden sitting above it. It's always at least as large as the "Exceeding %RE" curve at the same threshold — and exactly equal to it wherever the exceedance already reaches the surface.
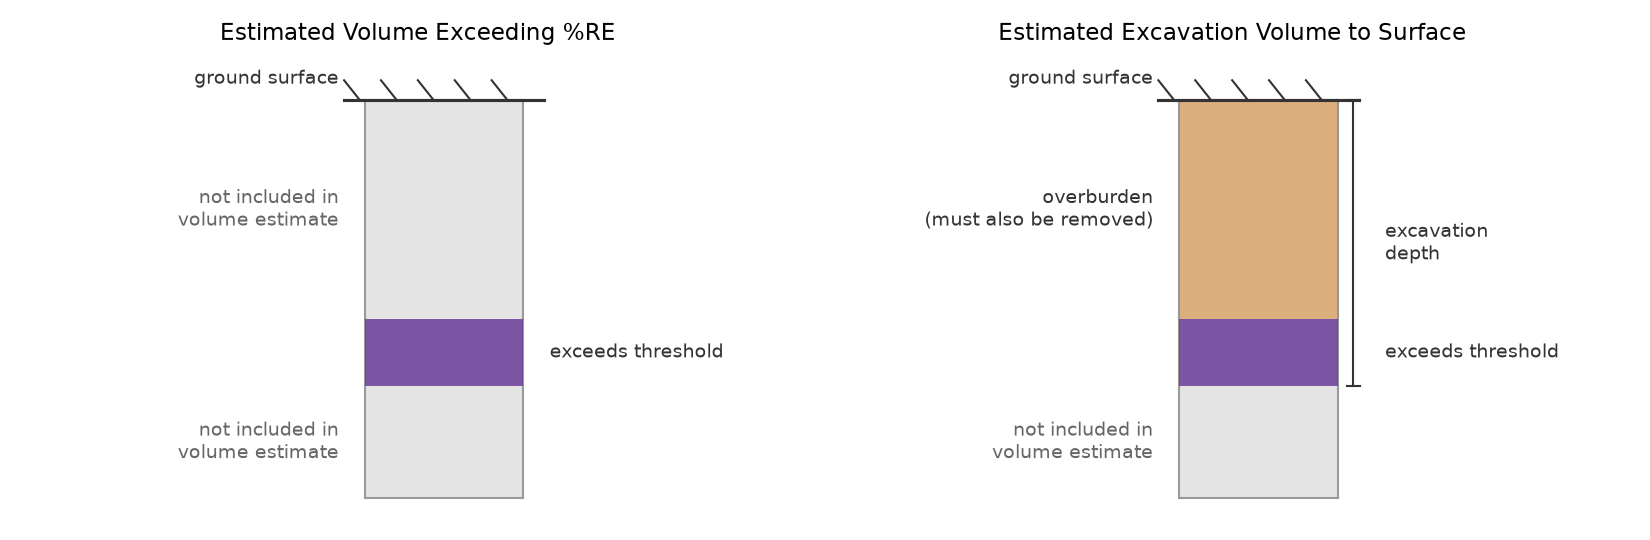
This is computed per vertical column across the interpolated grid: for each (easting, northing) location, we find the deepest cell that still exceeds the threshold, since an excavation has to reach all the way down to the bottom of the exceedance interval in that column, even if there's a non-exceeding gap partway through it. The volume from the surface down to that depth, summed across every column that meets the exceedance criteria, is the excavation estimate. Columns with nothing exceeding the threshold anywhere do not contribute to the excavation volume estimate.
There is one known limitation: this method treats the interpolated grid's own shallowest layer as the ground surface, which holds true for a normal LIF sample where logging begins near ground level. A site whose earliest logged reading starts unusually deep could see this curve underestimate the true excavation volume near the surface.